




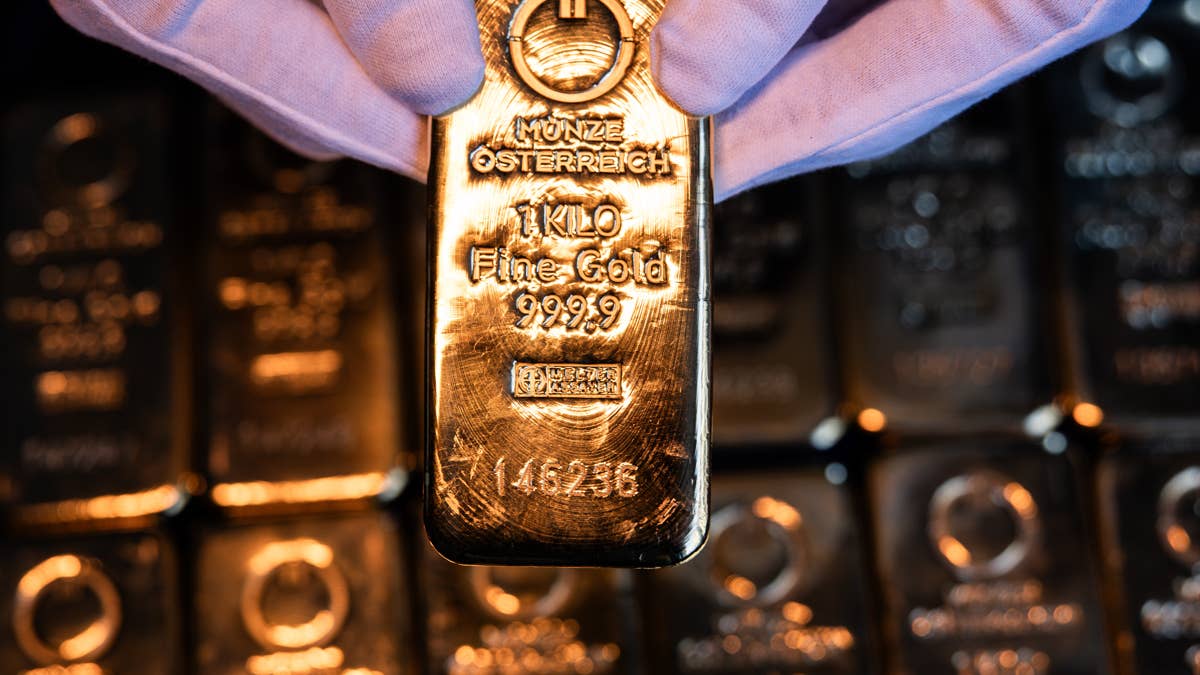




Gold is supposed to help investors sleep at night. When the stock market wobbles, inflation bites, or the economy looks uncertain, owning something tangible feels remarkably reassuring.
That said, gold hasn’t been especially reassuring lately.
After climbing to $5,595 an ounce in January, the precious metal has tanked 29%. On Friday, spot gold slipped below $4,000, a round number investors have been watching much more closely, and finished near $3,996.
That comes as a huge surprise after last year’s epic run for the shiny yellow metal and serves as an uncomfortable reminder that even a traditional safe haven can suffer a steep selloff.
And the next test could be even more important than the first: With gold finally finding a floor, does the correction still have further to run?
Gold prices break $4,000, putting a crucial July low to the test
- Top bank revises 2026 gold price forecast as investors reassess rally
- Wells Fargo resets gold price target amid rate concern
- Gold and silver crash as 10-year yield tops 5.2%
Spot gold finished Friday, October 23, at about $3,995.80 an ounce, after slipping as low as $3,975.64. Bullion lost roughly 4% for the week, its worst showing since June, and stood nearly 29% below January’s $5,595 peak.
Gold’s retreat wasn’t just another bad day for precious metals.
Surprisingly, the sell-off comes at a point when technology stocks are also taking a hammering. For perspective, the Vanguard Information Technology ETF is down 5% for the month, with the S&P 500 also in the red according to Seeking Alpha data. Yet gold wasn’t providing the protection investors often expect when Wall Street gets nervous.
The $4,000 mark is an obvious line in the sand. Traders watch round numbers, and a break can trigger stop-loss orders or encourage more selling. But the more meaningful test sits slightly lower.
In an October 20 technical report shared with me, Bank of America strategist Paul Ciana identified $3,943, gold’s July low, as a level to watch for a potential double bottom. Hold it, and a recovery case remains possible.
Break it, and the bank’s corrective scenario points toward $3,886 and eventually $3,700.
But the pressure isn’t coming from charts alone. Oil prices jumped on fears of Middle East supply disruptions, reviving inflation concerns just days before the Federal Reserve’s October 27-28 meeting.
Traders largely expected interest rates to remain unchanged next week but increasingly anticipated a December increase. Higher yields make non-interest-paying gold less appealing, while a stronger dollar adds another headwind.
That leaves an uncomfortable question for gold buyers: Was $4,000 merely a psychological casualty, or is the next leg lower already taking shape?
Bank of America sees gold falling to $3,700 as rivals eye $5,400
Gold’s break below $4,000 hasn’t exactly settled Wall Street’s argument over what comes next.
Bank of America technical strategist Paul Ciana says that gold might need more time, or another leg lower, to digest its previous rally. His October 20 report compares the current 38-week correction with earlier advances lasting 121 and 174 weeks.
“Our strategy remains to nibble below $4,000, add near $3,700 and commit remaining allocation in the $3,500-3,250 area,” Ciana wrote.
He argues that holding July’s $3,943 low might establish a double bottom, potentially setting up new highs in 2027.
Other Wall Street firms see an opportunity closer to today’s prices.
UBS considers pullbacks toward $4,000 potential buying opportunities, and forecasts gold reaching $5,400 by September 2027, as reported by Investing. Additionally, Goldman Sachs also targets $5,400 by the end of 2027, although it sees downside risk to its $4,650 forecast for this December, as reported by TheStreet.
Also, Morgan Stanley’s Amy Gower sounded particularly confident about the near-term outlook in September.
“I think we should see $4,000 as quite a strong floor,” she said in a CNBC interview, as reported by Kitco.
Friday’s drop put that prediction to the test. Still, investors haven’t abandoned gold.
According to the World Gold Council, nearly $10 billion flowed into gold-backed ETFs in September, contributing to a record $31 billion in Q3 inflows. ETF holdings climbed 67 metric tons to 4,256 tons despite falling prices.
But what would signal that the correction has finally run its course?
Gold investors face a crucial Fed decision and inflation test
The next clues might come from Washington rather than Wall Street.
The Federal Reserve’s October 28 decision and October 29 PCE inflation report could reshape expectations for interest rates. Hotter inflation or hawkish Fed commentary could push Treasury yields and the dollar higher, adding pressure on gold.
Conversely, cooling inflation, falling yields, and a weaker dollar would provide stronger grounds for a sustained recovery.
Investors should watch how gold reacts to those developments, rather than treating a single day’s rebound as confirmation of a bottom.
For retirement savers, there’s another consideration. Gold can help diversify a portfolio over time, but its recent selloff shows why money needed in the near term shouldn’t depend on its next rally.
Related: Jim Cramer’s 5% to 8% rule puts Nvidia stock in focus