


This preview of weekly data examines USOIL and XAUUSD, where economic data expected later this week are the primary market drivers for the near-term outlook.
Highlights of the week: US inflation, US PPI, UK GDP
Tuesday
- The US Inflation rate at 13:30 PM GMT is expected to remain unchanged at 2.7%, while core inflation is expected to increase by 0.1% for December. A worse-than-expected figure would likely further boost the already dominant scenario of unchanged rates at the next Fed meeting, while a lower reading could support a more dovish stance, and the probabilities of a rate cut could rise.
Wednesday
- Chinese Balance of trade at 03:00 AM GMT, where the figure for the month of December is expected to increase from $111.68 billion to $113.5 billion. If this is broadly accurate, then it might create some gains for the currency.
- U.S Producers Price Index (PPI) at 13:30 GMT. Market participants expect the figure to remain stable at 0.3% for October, with the November figure anticipated to decline to 0.2%. If this is confirmed, it could potentially indicate that inflation may slow down in the next reading, as producers’ costs usually roll down to consumers, pushing inflation figures to the upside. Conversely, if they remain stable, it could hint that inflation may not increase in the near-term outlook.
Thursday
- British GDP growth at 07:00 AM GMT. The market consensus is that the figure will be increased from -0.1% to 0% month over month. This may not have a significant impact on the pound, given that it is for the month of November; however, it could provide some insight into the overall economic performance of the British economy.
USOIL, daily
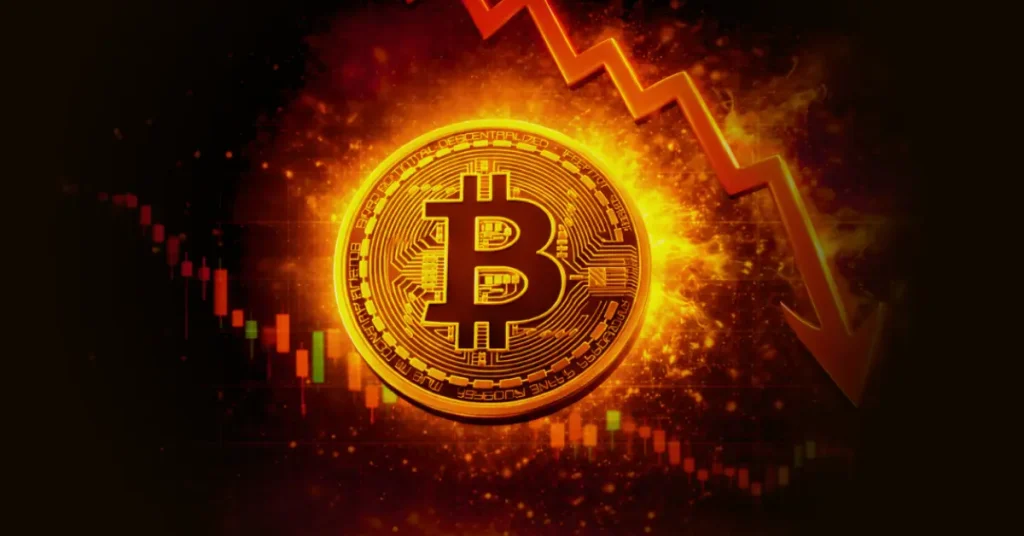
Oil prices dipped as investors assessed Iran’s statement that it has regained “total control” after weekend violence, reducing immediate concerns about supply from the OPEC producer and tempering recent gains. While markets also weighed efforts to resume Venezuelan exports, overall sentiment remained cautious, with traders needing clearer signs of actual disruptions before moving prices significantly. Prices had climbed last week due to heightened geopolitical tensions, but the expectation that supply interruptions would be limited kept prices within a relatively narrow range. Ongoing unrest in Iran and geopolitical risks remain on traders’ radar, but without visible output impacts, prices are expected to stay range-bound unless demand strengthens or supply disruptions materialise.
On the technical side, the crude oil price has, once again, found sufficient resistance exactly on the major technical resistance area consisting of the 38.2% Fibonacci retracement level, the 100-day simple moving average, and the upper band of the Bollinger Bands, which is also just below the psychological resistance of the round number ($60). It seems that a major catalyst will be needed to break above this level in the near term, as the moving averages continue to validate an overall bearish trend in the market. The extremely overbought Stochastic oscillator also points to lower levels in the upcoming sessions, so the next level of support may be seen around the $58 level, which is comprised of the 23.6% Fibonacci retracement, the 50-day SMA, and an area of previous price reaction since late December.
Gold-dollar, daily
Gold and silver both hit record highs as investors sought safe-haven assets amid heightened geopolitical and economic uncertainty. Gold surged above $4,600 an ounce for the first time, while silver also climbed to a historic peak, driven by concerns over global instability and growing expectations that the U.S. Federal Reserve will cut interest rates in 2026. Market stress around U.S. central bank leadership and weaker U.S. jobs data boosted demand for non-yielding metals, with traders pricing in multiple rate cuts ahead. Safe-haven buying and subdued interest-rate expectations underpinned the rally despite mixed signals on when monetary easing will actually occur.
From a technical standpoint, gold has pushed to yet another all-time high just days into 2026, reinforcing the strength of the ongoing uptrend. Price action is currently pressing against the upper Bollinger Band, signalling strong bullish momentum and elevated volatility. At the same time, the Stochastic oscillator is sitting deep in overbought territory, which under normal conditions could raise the risk of a short-term pullback. However, in gold’s case, this signal should be treated with caution, as price behaviour is currently being driven far more by macro and geopolitical fundamentals than by traditional technical mean-reversion dynamics. The broader trend structure remains firmly bullish, with short- and long-term moving averages aligned to the upside and providing dynamic support on any shallow retracements. Momentum remains intact, and there are no clear signs of distribution or trend exhaustion yet
Disclaimer: The opinions in this article are personal to the writer and do not reflect those of Exness or Finance Feeds.